Quality assurance as well as concern regarding sample authenticity in biotechnology and bioengineering have always been serious topics in both production and research. While next generation sequencing techniques greatly enhance in-depth analyses of DNA-samples, they, however, introduce additional error-sources. Resulting error-signatures can neither be easily removed from resulting sequencing data nor even recognized, which is mainly due to the massive amount of data. Altogether biologists and sequencing facility technicians face not only issues of minor relevance, e.g. suboptimal library preparation, but also serious incidents, including sample-contamination or even mix-up, ultimately threatening the accuracy of biological conclusions.
Unfortunately, most of the problems and evolving questions raised above can't be solved and answered entirely. However, the sequencing data quality control tools of the Seqomics Ltd. provides various generic tools to assist in the quality control process of the samples by assessing and visualizing statistics on:
- Sequence-read lengths and base-coverages
- Nucleotide-contributions and base-ambiguities
- Quality scores as emitted by the base-caller
- Over-represented sequences and hints suggesting contamination events
The sections below describe the contents of the report. Note that the two terms "per-sequence" and "per-base" are used frequently in the following descriptions. The generated report is divided into per-sequence and per-base sections. In per-sequence assessments some characteristic (a single value) is assessed for each sequence and then contributes to the overall assessment. In per-base assessments each base position is examined and counted independently.
The report comes in two different flavors: a supplementary report consisting of tables representing all the values that are calculated, and a main summary reports where the tables are visualized in plots (see an example in figure 1.). Both reports can be exported as pdf files or Excel spread sheets.
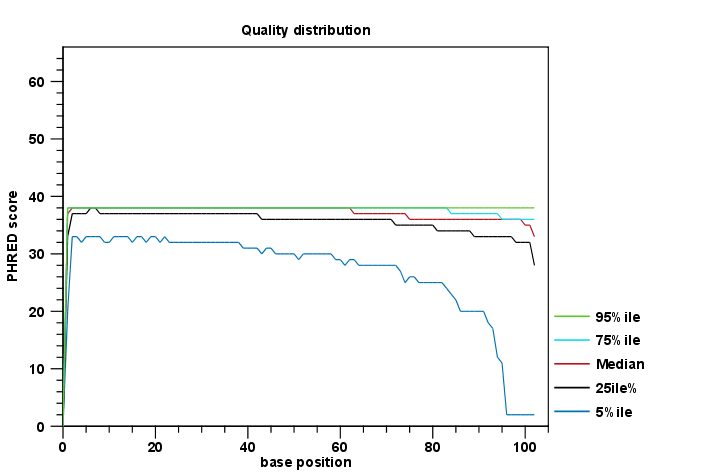
Figure 1: An example of a plot from the graphical report, showing the quality values per base position.
Basic analysis
The basic analysis section assesses the most simple characteristics that are supported by all sequencing technologies.
The Summary table provides information regarding the creation date, the author, the software used, the number of data sets the report is based upon, as well as data name and content in terms of read number and total number of nucleotides.
- Sequence length distribution: Counts the number of sequences that have been observed for individual sequence lengths. The resulting table correlates sequence-lengths in base-pairs with numbers of sequences observed with that number of base-pairs.
- Base coverage distribution: Calculates absolute coverages for individual base positions. The resulting table correlates base-positions with the number of sequences that supported (covered) that position.
- Sequence-wise %GC-content distribution: Counts the number of sequences that feature individual %GC-contents in 101 bins ranging from 0 to 100%.The %GC-content of a sequence is calculated by dividing the absolute number of G/C-nulceotides by the length of that sequence.
- Sequence-wise %N-content distribution: Counts the number of sequences that feature individual %N-contents in 101 bins ranging from 0 to 100%, where N refers to all ambiguous base-codes as specified by IUPAC.The %N-content of a sequence is calculated by dividing the absolute number of ambiguous nucleotides through the length of that sequence.
- Base-wise nucleotide distributions: Calculates absolute coverages for the four DNA nucleotides (A, C, G or T) for each base position in the sequences.
- Base-wise GC-distribution: Calculates absolute coverages of C's + G's for each base position in the sequences.
- Base-wise N-distribution: Calculates absolute coverages of N's, for each base position in the sequences, where N refers to all ambiguous base-codes as specified by IUPAC.
Quality analysis
The quality analysis examines quality scores reported from technology-dependent base callers. Please note that the NGS import tools of the Seqomics Ltd. convert quality scores to PHRED-scale, regardless of the data source. The following quality distributions are reported:
- per-sequence quality distribution: Calculates amounts of sequences that feature individual PHRED-scores in 64 bins from 0 to 63. The quality score of a sequence as calculated as arithmetic mean of its base qualities.
- per-base quality distribution: Calculates amounts of bases that feature individual PHRED-scores in 64 bins from 0 to 63. This results in a three-dimensional table, where dimension 1 refers to the base-position, dimension 2 refers to the quality-score and dimension 3 to amounts of bases observed at that position with that quality score.
Over-representation analysis
The 5-mer analysis examines the enrichment of penta-nucleotides. The enrichment of 5-mers is calculated as the ratio of observed and expected 5-mer frequencies. The expected frequency is calculated as product of the empirical nucleotide probabilities that make up the 5-mer. (Example: given the 5-mer = CCCCC and cytosines have been observed to 20% in the examined sequences, the 5-mer expectation is $ 0.2^5$). Note that 5-mers that contain ambiguous bases (anything different from A/T/C/G) are ignored.
Individual 5-mer distribution
Calculates the absolute coverage and enrichment for each 5-mer (observed/expected based on background distribution of nucleotides) for each base position, and plots position vs enrichment data for the top five enriched 5-mers (or fewer if less than five enriched 5-mers are present). This analysis will reveal if there is a pattern of bias at different positions over the read length. Such a bias might origin from non-trimmed adapter sequences, poly-A tails or other sources.
Duplicated sequences analysis
The duplicated sequences analysis identifies sequences that have been sequenced multiple times. In order to achieve reasonable performance, not all input sequences are analyzed. Instead a sequence-dictionary is used, whose entries are sampled evenly from input sequences. Please note that if you select multiple sequence lists as an input, they will all be considered one data set for this analysis (batching can be used to generate separate reports for an individual sequence list). As soon as a sequence makes it into the dictionary (which is a random process), it is tracked for duplicates until all sequences have been examined. The dictionary size is 250 000 sequences.
Because all current sequencing techniques tend to report fading quality scores for the 3' ends of sequences, there is a risk that duplicates are NOT detected, just because of sequencing errors near their 3' ends. Therefore, the identity of two sequences is calculated using only the first 50nt from the 5' end.
Sequence duplication levels
This results in a table correlating duplication counts with the number of sequences that featured that duplicate-count. For example, if the dictionary contains 10 sequences and each sequence was seen exactly once, then the table will contain only one row displaying: duplication-count=1 and sequence-count=10. Note: due to space restrictions the corresponding bar-plot shows only bars for duplication-counts of x=[0-100]. Bar-heights of duplication-counts >100 are accumulated at x=100, such that a significantly elevated bar-height at x=100 is a normal observation. Please refer to the table-report for a full list of individual duplication-counts.
Duplicated sequences
This results in a list of actual sequences most prevalently observed. The list contains a maximum of 25 (most frequently observed) sequences and is only present in the supplementary report. (Source: https://www.qiagenbioinformatics.com)